Step 2
By Vinzenz Unger and Anchi Cheng
Correction of lattice distortions, extraction of raw image data and correction of phases for the effect of the contrast transfer function (CTF)
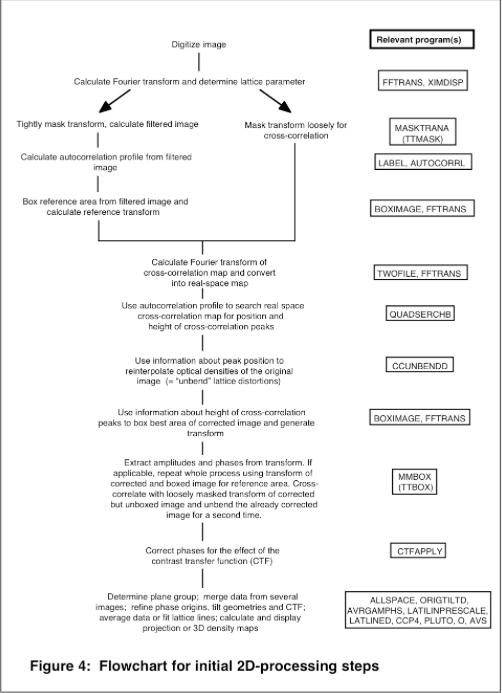
The steps that are necessary to generate the basic image data are outlined in Fig.4.
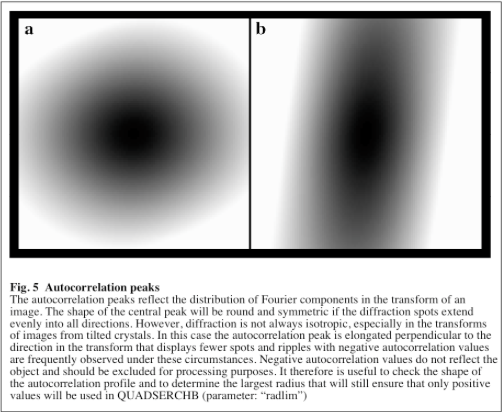
As mentioned in the previous paragraph lattice distortions can be identified by cross-correlation procedures between a reference area and the original image. Most conveniently this is done in reciprocal space (program: TWOFILE) because in this case it amounts to a multiplication of the loosely masked transform of the image with the complex conjugate of the transform of the reference area (see REF for more detailed explanation). Backtransformation of the cross-correlation map is the first step to translate its information into real space disorder parameters. Consecutively, all unit cells can be searched for the exact position (= offset) of the object and the degree of similarity with the reference area (program: QUADSERCHB). In practical terms this is achieved by first correlating the object (or part of it) with itself. This so called autocorrelation map is calculated from a small part of the reference area and its centre appears as a more or less symmetrical peak (see Fig.5) whose shape depends on the actual distribution of Fourier terms in the image (program: AUTOCORRL). Finding the best fit of this central peak and the cross-correlation peaks for the individual unit cells provides the length and orientation of the distortion vectors and goodness (=height) of correlation. It should be mentioned that QUADSERCHB only determines the translational offset for the cross-correlation peak but does not take into account any rotational disorder. Once the distortion vectors are known, the original image can be corrected by re-interpolating its optical densities to bring the unit cells onto a “perfect” lattice (program: CCUNBENDD).
From this outline it becomes clear that the quality of the reference area is the main factor to the success of the “unbending” procedure because any disorder present in the reference will remain uncorrected. Accordingly, improvements in the quality of the reference area by successive passes of processing make the determination of the lattice distortions and consequently, the correction of the image more accurate. In most cases the result will not get any better after 2-3 passes of image filtering and lattice unbending. However, a further improvement can be obtained once a 3D model is available, because in this case a “perfect” reference area can be created de novo by calculating a back projection of the model for the “precise” imaging conditions (program: MAKETRAN)
A second factor, which greatly influences the quality of the data, is the image area that is used to generate the final transform. As mentioned above, the cross-correlation provides a measure how well each individual unit cell corresponds to the motif defined by the reference area. Choosing an appropriate cross-correlation cutoff for boxing (program: BOXIMAGE) the best image area has a large impact on the data quality and resolution. In our experience boxing is particularly important if a significant number of unit cells shows cross-correlation levels of less than 50%. This is more likely to occur for specimens that are only ordered to intermediate resolutions (5-10Å) and for thick specimen (> 150Å). However, it should be mentioned that choosing too small an area will result in a number of random reflections at higher resolution that appear to have a significant signal-to-noise ratio. This effect can be minimized by insuring that the boxed area still contains several thousand copies of the molecule. In our experience coherent areas of ~4000-5000 molecules with cross-correlation values of ≥75% are sufficient to provide reliable data in the 5-10Å regime.
Once the best area was selected and transformed the program MMBOX is used to extract raw data. The output is a file that lists the amplitude, phase, quality, background and a dummy column used in the next step for each of the unique (h,k) reflections. The quality of each measurement is based on the signal-to-noise ratio and is expressed as “IQ” value. Measurements with a signal-to-noise ratio of at least 8 have an IQ=1 whereas an IQ=8 indicates that the measurement was above the background noise but only within the standard deviation of the pixel intensities around the predicted peak position.
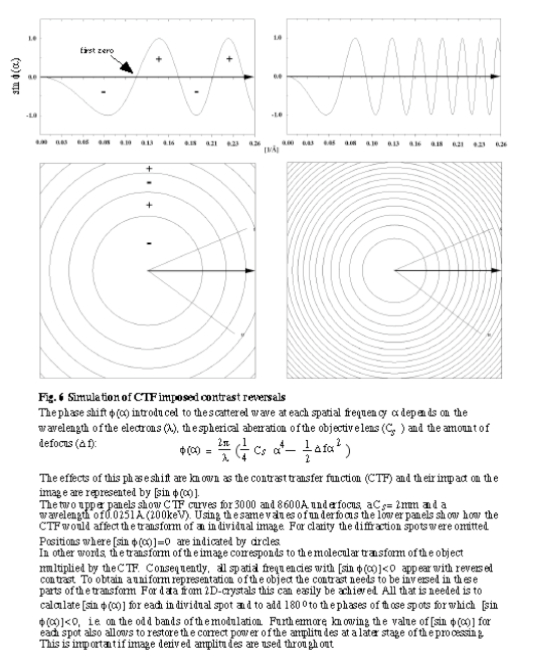
The next step consists in an initial correction of the phase data for the effect of the contrast transfer function (CTF; program: CTFAPPLY). The CTF is a modulation of the scattered waves by the objective lens, which results in periodical contrast reversals across the image (see Fig.6). In reciprocal space this corresponds to a phase shift by 180˚ in certain parts of the transform. Because this modulation will be different for each image (due to their different amounts of underfocus) the phases must be corrected to allow the combination of data from several images. The visual manifestation of the CTF is a characteristic pattern of alternating light and dark bands (= Thon rings) in the diffuse diffraction patterns of amorphous materials. The dark areas correspond to frequencies that are not or only poorly transferred and hence do not contribute to the formation of the image. Vice versa, good transfer is achieved in the bright areas. This phenomenon can be used to determine the defocus, which then allows simulating the modulation and to correct for the CTF imposed contrast reversals.
The initial estimate of the amount of underfocus should be as accurate as possible to avoid potential problems later on. This is particularly true for thick specimens where the molecular transform is not as constrained. Errors in the initial underfocus estimate can make the buildup of a three-dimensional data set a lot more difficult in these cases. Using the nominal underfocus at which the image was recorded is not advisable because the actual underfocus will often be significantly different. A more accurate estimate can be obtained from the Thon ring pattern if this is visible in the calculated transform.
- Determine if the image shows astigmatism. In this case the concentric nodes in the Thon ring pattern appear ellipsoidal instead of round.
- Determine the transform coordinates of a point within the first zero of the pattern (see Fig.6). If the image is astigmatic determine a point on each of the principal axes of the ellipse.
- Calculate the length of the reciprocal space vector that connects the chosen point(s) with the transform origin: l = √x2+y2 ; where x and y are the coordinates read off the transform.
- Convert the length of the vector into reciprocal Å
- Calculate a set of reference curves (program: CTFCALC; see Fig.6, upper panels) and match against the value obtained from equation (4). The amount of underfocus that places the first zero closest to this value is the starting estimate.
- Correct the phase data by running CTFAPPLY and store both the raw and CTF-corrected data lists for future use.
It is important to keep the original list of raw data since refinement of the initial underfocus values is inevitable at a later stage of the data handling.
Multiple passes of image filtering and lattice straightening
There are two major options how to perform a second pass of filtering and unbending. In our hands the best results are achieved if the corrected and boxed image is used to generate the reference area while the masked transform of the simply unbend but unboxed image provides the counterpart for the cross-correlation. In this case the full sized, already corrected image will be unbend a second time and the final data are extracted from its transform after boxing off the best area. A protocol for this procedure can be obtained from out ftp-site (“JOBB.com”). However, generating the reference from the boxed and corrected image and using the uncorrected image for the cross-correlation is equally possible. Which option works best for a particular specimen will have to be determined empirically. Differences between these two approaches are likely to occur in cases where the specimen is ordered to intermediate resolutions only.


