Step 5
By Vinzenz Unger and Anchi Cheng
Determination of tilt geometries
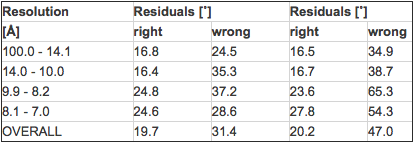
The determination of accurate tilt geometries is important for the buildup of a three-dimensional data set. In praxis, the crystal tilts are usually different from the nominal tilt of the sample holder and deviations of ±5-8˚ are commonly observed. This may just be acceptable for a thin specimen. However, it is strongly recommended to avoid using nominal tilts as starting estimates, especially for thick specimens (>120-150Å) because in these cases the data will not merge unless the tilt parameter are within (2-3˚) of the “true” tilt geometry. To illustrate the latter point phase residuals for a single image of gap junction channels were calculated against a refined 3D data set using the correct and two wrong amounts of overall tilt.
Table 5 Effect of inaccurate tilt angle on phase statistics
The large impact on the phase residuals (i.e. agreement between the images) can be seen even for a deviation of 4˚, which is well within the possible range of error between the nominal tilt of the cryo-holder and the actual tilt of the specimen. Furthermore, only the amount of tilt was varied in this example. In praxis one also can anticipate errors in the positioning of the tilt axis, which will further degrade the agreement. Lastly, the example used a refined 3D data set as reference emphasizing that the additive effects of inaccuracies in a number of unrefined images can make it difficult if not impossible to start building a 3D data set. Fortunately, these effects are not as pronounced for a thin specimen and hence the requirements for getting reliable starting estimates are less stringent. However, note that the degradation of phase residuals caused by inaccurate tilt parameters looks very similar to the effect of errors in the defocus assignments (see Table 4) or errors in the assignment of the absolute sign of the tilt angle (see Table 8). Therefore, it is strongly recommended to get accurate starting estimates for thin specimens as well. Equally important is to not confuse potential sources of disagreement between image data. An appropriate strategy to resolve these ambiguities is described later.
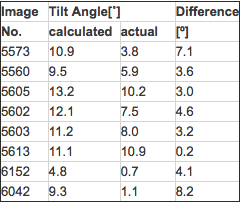
At crystal tilts above 30˚ the geometry can be reliably calculated from the distortion of the lattice parameters (program: EMTILT). However, this is not true for small tilts because the expected distortions are small and inaccuracies in the determination of the lattice parameters for the tilted as well as the untilted specimen result in random errors that frequently are unacceptable. Table 6 lists a few examples.
Table 6 Errors for calculated tilt angles at small crystal tilts
In some cases the errors appear small and may be tolerable, especially if the specimen is less than 100Å thick. However, it should be noted that the table only lists errors for the amount of tilt. The situation becomes a lot worse if the errors for positioning of the tilt axis are considered as well. Table 7 shows the phase statistics for the two “best” images from Table 6 if the “calculated” (wrong) tilt geometries are used instead of the refined actual values (or a sufficiently close starting estimate).
Table 7 Impact of wrong tilt geometries at small specimen tilts
The result obtained for image 5613 illustrates the importance to position the tilt axis correctly. Again, notice that residuals for the “wrong” geometries were obtained by comparison against a refined averaged data set, i.e. results would be worse if unrefined image data were used instead as is the case at the beginning of any merging procedure. In summary, obtaining the best possible starting estimates for the CTF and tilt geometry regardless of the specimen thickness makes the initial merging and refinement steps significantly easier.
In case of the tilt geometry a rough but nevertheless reliable starting estimate can be obtained by analyzing the changes in the Thon ring pattern across the image if the Thon rings are visible in the transform of the image. As illustrated in Fig.13 the different parts of the specimen plane will be at different heights in the electron microscope column if the specimen is tilted with respect to the incident electron beam. This height difference across the specimen translates into a defocus gradient at the image plane if the image is recorded at a constant setting for the objective lens current. From Fig13. it also becomes clear that parts of the specimen that are higher up in the column will appear less underfocussed on the image (note: the general amount of underfocus used to record the image should be sufficient to prevent any part of the image ending up overfocussed). The visual manifestation of defocus differences across the image is a “breathing” of the Thon ring pattern, because as illustrated previously the number and radial distribution of the nodes in the contrast transfer function (CTF) directly depend on the amount of defocus. Naturally, the changes in the pattern will be most pronounced in the direction perpendicular to the tilt axis and this effect can be used to determine the overall tilt geometry by optical diffraction:
- First, identify the approximate position of the tilt axis. To do this, move the micrograph in all directions and find the direction of movement in which the Thon ring pattern remains (almost) constant. The projected tilt axis is along this direction, because there is no height difference along the tilt axis (= no change in the Thon ring pattern). Mark the position of the tilt axis on the micrograph if possible or keep a separate record.
- Second, move the micrograph in a direction perpendicular to the tilt axis and determine which side of the micrograph has less/more underfocus. Translate this into what part of the specimen was higher up/lower down in the microscope column and write these assignments onto the micrograph if possible or keep a separate record. The side of the micrograph for which the diameter of the Thon rings is larger indicates a lower amount of underfocus. Accordingly, this part of the specimen was higher up in the column.
- Third, make a note about the approximate relationship between the two lattice vectors (a* and b*) and the tilt axis. Important: assign the axes the same way as for the image processing, otherwise the tilt geometry will not be correct.
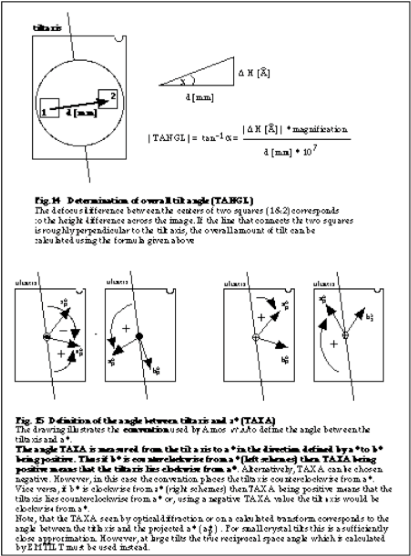
- Fourth, scan two square areas, 1000×1000 pixel at 25μm stepsize each on either side of the tiltaxis. Choose the largest possible distance between the two squares and make sure that the line connecting the centers of the squares is roughly perpendicular to the tilt axis. Calculate or measure the centre-to-centre distance of the two squares and keep this number.
- Fifth, transform the two smaller areas and determine the defocus values as described earlier. The difference between the two values is the height difference between the centres of the squares. Use this information, the centre-to-centre distance and knowledge of the exact magnification to figure the amount of tilt as shown in Fig.14. Important: if you cannot resolve a clear difference in defocus, do not use this image in an inital attempt to merge 3D data.
- Sixth, determine the angle between the tiltaxis and a* (TAXA). For small tilts this value can be approximated by measuring the angle between the projected tilt axis and the projected a* as shown in Fig.15. Note: the schematic in Fig.15 follows the convention of Amos et al.. as do the programs ORIGTILT and MAKETRAN. Accordingly, 3D data cannot be merged using these programs without following the same convention.
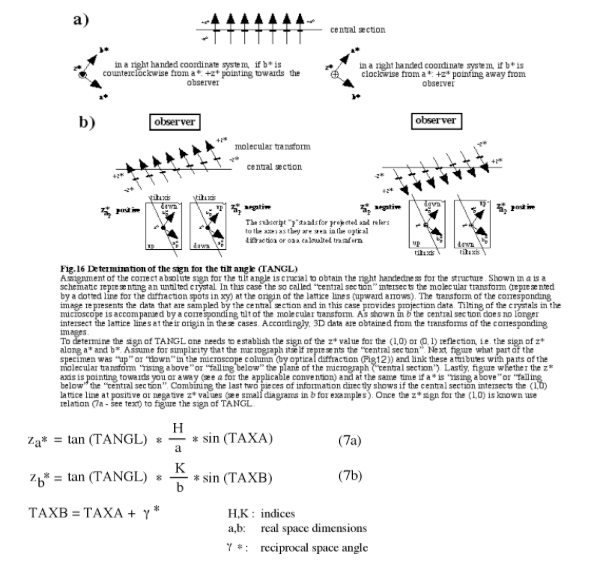
- Seventh, determine the sign of the tilt angle (TANGL). To do this, figure the sign of z* for the (1,0) reflection as shown in Fig.16 (or of the (0,1) reflection if a* lies directly or close to the direction of the tilt axis). Depending on which of the two possible TAXA (Fig.15) values was chosen, adjust the sign of TANGL to satisfy the following relationships:
For instance, if TAXA has a value of +60˚ and za* was determined to be negative then the sign of TANGL must be negative to satisfy (7a). However, if TAXA was chosen to be -120˚ (which is equally correct) then the sign of TANGL must be made positive to satisfy (7a). In other words, there are always two equally correct ways to describe the tilt geometry in accordance with the MRC convention. Note: if a* is close to the tilt axis use zb* and relation (7b) to determine the sign of the tilt angle because the sign of zb* will be unambiguous.
It should be stressed that the sign of TANGL has to be determined for all images - even those where the specimen was highly tilted because calculation of the tilt geometry from the distortion of the lattice parameters does not account for the conventions used in calculating the z* components of the diffraction spots. Equally important is to remember that all given schematics depend on the orientation of the displayed image being identical to the orientation of the film in the microscope. In addition, all observations and records from the optical diffraction must also be consistent with this orientation. For instance, on most systems the image origin (=first pixel scanned) will be displayed in the top left corner of the screen. If however the scan was started in the lower left corner of the image (to comply with the convention used by all MRC routines) the image will be flipped upside down on the display and accordingly the sign of TANGL will come out wrong if all the above conventions are applied. To rectify this situation one either works out rules that translate all of above conventions to the specific situation at hand or manipulates the orientation of the image before any processing is done. In the given example the image could simply be flipped back computationally to bring the first pixel to the lower left corner. Alternatively, one could interchange a* and b* and hence the direction of z* (just!) for the determination of the sign of TANGL. Likely some of the “translation” rules will be confusing and usually it is easier to make computational adjustments, which will orient the displayed image to match the real image before any processing is done.
The importance of finding the correct sign for the tilt angle lies in its impact on the handedness of the structure. Unfortunately, errors in the assignment of the sign of TANGL are more common at low specimen tilts, because as little as a buckle in the carbon support film can invalidate the outlined procedure in this tilt regime. Even more unfortunate is that the buildup of any 3D data set necessarily will start by including data from images with low specimen tilts, because only in these cases will there be enough shared reflections that can be used to determine the common phase origin. It is necessary to point out that data will refine equally well for the two possible stereochemistries. However, which one to choose is not a matter open to discussion since only one of the two possible solutions is correct. If there are any doubts about any assignments get a data set for bacteriorhodopsin along with some purple membrane. Glucose-embed some sample and record a few tilted images. Process these images exactly as images of your own specimen, assign all tilt parameter and check against the provided reference data if your procedure is correct.
In summary, the handedness of the images at low crystal tilts must be checked carefully especially for specimens that are only ordered to intermediate resolutions, because in these cases one cannot rely on the stereochemistry of the α-carbon backbone of the main chain to settle the question. In this situation only the following countermeasures are available to avoid mistakes:
- Use only those images where clear differences in the Thon ring pattern can be seen. At small crystal tilts with small differences in height across the image only the rapid changes of the pattern that are observed for low underfocus values will qualify.
- Never start building a new 3D data set by merging images one at a time, always use groups of images for which the apparent tilt geometries have been defined independently.
- Always check that the overall geometry for which the best phase agreement with the remaining data is achieved is consistent with the observations made by optical diffraction. If this is not the case stop and investigate.
- After merging a set of images from crystals with low tilts, calculate phase residuals for both signs of the tilt angle (see Tab.8). While an individual assignment may have been incorrect due to difficulties outlined above, the data set as a whole should have the correct hand. If this is true, then wrong assignments will show up by giving a better agreement if the “apparently wrong” sign (i.e. opposite of what was determined) is used. Remove the image in question from the data set, if the number of images in the reference is still small and repeat this procedure once more images were added. If the “change of handedness” is persistent, then adjust the value accordingly, but keep a record when and why the hand was changed.
The following table illustrates that the phases will only agree for one of the two solutions once a handedness has been fixed:
Table 8: Impact of wrong handedness
The image that was used had a tilt of 0.72˚. In this particular case the difference between the two possibilities is very pronounced because an averaged and refined data set had been used as reference. Furthermore, the specimen thickness is >150Å and hence, the molecular transform has a very characteristic shape that allows good discrimination. With an unrefined data set and in case of a thin specimen the differences will be less pronounced but usually one of the two possibilities gives a better agreement. If this is not the case do not proceed and try to find more good images first. However, at this point it is important to remember that reasons other than assigning the wrong hand can cause disagreements in the phases at this stage of data handling (see tables 4 and 7). It is therefore necessary to devise a strategy that can help to discriminate between the different potential problems.


