Explanation of the 2dx GUI
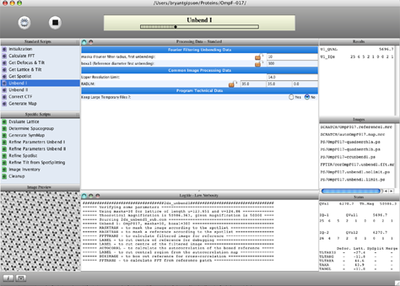
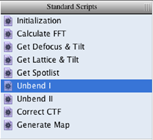
The upper left pane in the 2dx interface contains all scripts, which will be useful in one round of a sequentially executed workflow. Each script represents an individual processing routine and groups of such scripts may be executed sequentially via multiple selection.
Assuming that the 2dx/config/2dx.cfg is properly configured (for binary distributions this should nearly always be the case) double clicking on any of the scripts will open it for editing in the editor selected in the configuration file.
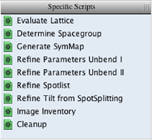
The Specific Scripts
(located just below the Standard Scripts) are accessed and run in a manner similar to those above. Specific Scripts, however, are designed to fulfill auxiliary roles, supporting the Standard Scripts and do not execute sequentially. In the scripts included with the 2dx release are a number of specific function scripts designed to make processing easier, or to fulfill specific alternate roles. For example it may not always be desirable to generate a symmetrized final map in the final stage of processing. This is then left as a Generate SymMap script, which can be optionally executed as a last step.
The center window, Processing Data, presents all processing parameters relevant to the particular script being executed. Variables found here may take the form of text boxes, drop down menus, push buttons or any other kind of standard input type. All of these are dynamically generated from an external configuration file, which is locally stored in the image directory.
Certain variables may be locked to prevent both accidental changes by users and, more importantly, intentional changes from running scripts. For example users may wish to protect a manually refined lattice but still wish to see the results of Get Lattice & Tilt which generates a number of other results related to the reciprocal lattice. Clicking the Lock icon next to the lattice parameters will prevent change to this variable, though all non-locked variables will still change accordingly.
Every parameter appearing in the Processing Data window has an associated context sensitive help feature accessible via right-click. This help will display the variable’s unique identifier (in this case magnification) as well as a short description of the parameter. The last line in this help window is a link to online help for this variable at http://2dx.org, where one can find detailed descriptions for every parameter as well as documentation. If 2dx/config/2dx.cfg contains a line specifying a web-browser, clicking this link will automatically direct it to the appropriate page
Any script may be executed by clicking on the Play button in the upper left corner of the GUI. As the script is executing, the progress bar will advance according to directives found in the script. In almost all cases the bar represents a rough time-based estimate of progress (as opposed to step based).
Occasionally scripts may take advantage of the control and reset the progress at various stages, for instance those that run through multiple iterations of a particular image processing phase.
During the execution of any script a user may halt the execution by pressing the Stop button (though the process by which the currently running sub-program is halted is os-dependent and may take awhile).
The top of the Processing Data window contains two buttons. The first (aqua) is default and presents the user with the most common parameters of interest to the current script. The second (red) displays all parameters available to the script. Parameters found only under the “Advanced” heading are frequently changed once and then left alone, or generally produce “acceptable” results when defaults are applied.
As scripts are run their output is displayed to the Logfile Browser, located in the bottom center of the GUI. This is a reduced version of the full Log Browser, which can be accessed via double clicking the top bar of this window, or by right click in the text area. The output can be filtered according to one of 3 verbosity modes. Low, which shows only the most important output of the script, medium, which shows slightly more detailed information and highest which displays all available output. (Clicking these buttons will not alter the verbosity of data that has already been displayed and will only affect future updates to this window. To view the full log file use the Log Browser.)
Once a script has finished executing, the parameters, which it has altered, are displayed in the upper right of the GUI in the Results window. If a script completes and a variable is locked, the parameter it tries to change will appear in red in this window. All parameters appearing in black represent those that (assuming they were present in the database) were successfully altered. This window is also often used for display purposes, as in the case of Evaluate Lattice where a calculated real unit cell is displayed in the Results window, but the actual values are not updated into the global database.
Similar to the Results window (and located just below) is the Images window . Here image names that are related to the current processing task are displayed upon script completion. Clicking once on any of the image files listed in this view will display information about it in the preview window. Double clicking an image will launch the fullscreen Navigator for mrc-format images or the postscript viewer (defined in 2dx/config/2dx.cfg) in the case of postscript images.
The Image Preview/Header window, located in the bottom left corner of the GUI, displays information about the currently selected image. The header view displays the entire header of the MRC file, (without labels) while the image preview displays a 200 x 200 preview of the image.
The preview is generated once, then added to the end of the same image file as a second Mode 0 MRC file section, complete with header. Pressing the I in the bottom left corner of the GUI allows switching between header and preview mode.
The Show/Hide buttons hide the Preview/Header from view. When in either Header mode or hidden from view no previews will be generated for any of the selected images –preview generation occurs once, the first time Preview mode is initiated for the image.
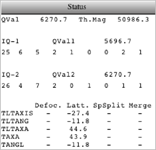
The Status window , found in the bottom right corner of the GUI displays a number of values relevant to the overall processing of the image. In particular, the two rows in the center of this window list the number of spots, found in the final post-unbending power spectrum, of given IQ values. In the example the first unbending step found 25 spots of IQ 1, 6 of IQ 2, 5 of IQ 3, and so on. The bottom 4 columns display the tilt geometry as calculated by 4 different methods: Defocus gradient, Lattice distortions (emtilt), Spot Splitting evaluation (ttrefine), and from 3D Merging of the data (origtilt).
The theoretical magnification , as calculated from the current lattice, real unit cell, etc, is listed in the upper right or this window. Ideally this value will be nearly identical to the manually specified magnification and servers as an indication of fitness of values. The quality value, shown in the upper left, represents an empirical measure of overall image “fitness” based on a number of factors, including IQ values.
